Aug 12, 2021
Metrics and graphs with M3 and Grafana
Find out how to use M3 to monitor your systems, and Grafana to make the results easier to understand.
Lorna Mitchell
|RSS FeedDeveloper Advocate at Aiven
One key use case for Aiven for M3 is for handling the monitoring data from other systems. In this post you will do just that, by setting up a PostgreSQL service and collecting metrics from it using M3. To complete the picture, Grafana will be used to inspect the collected data.
Start with something to monitor
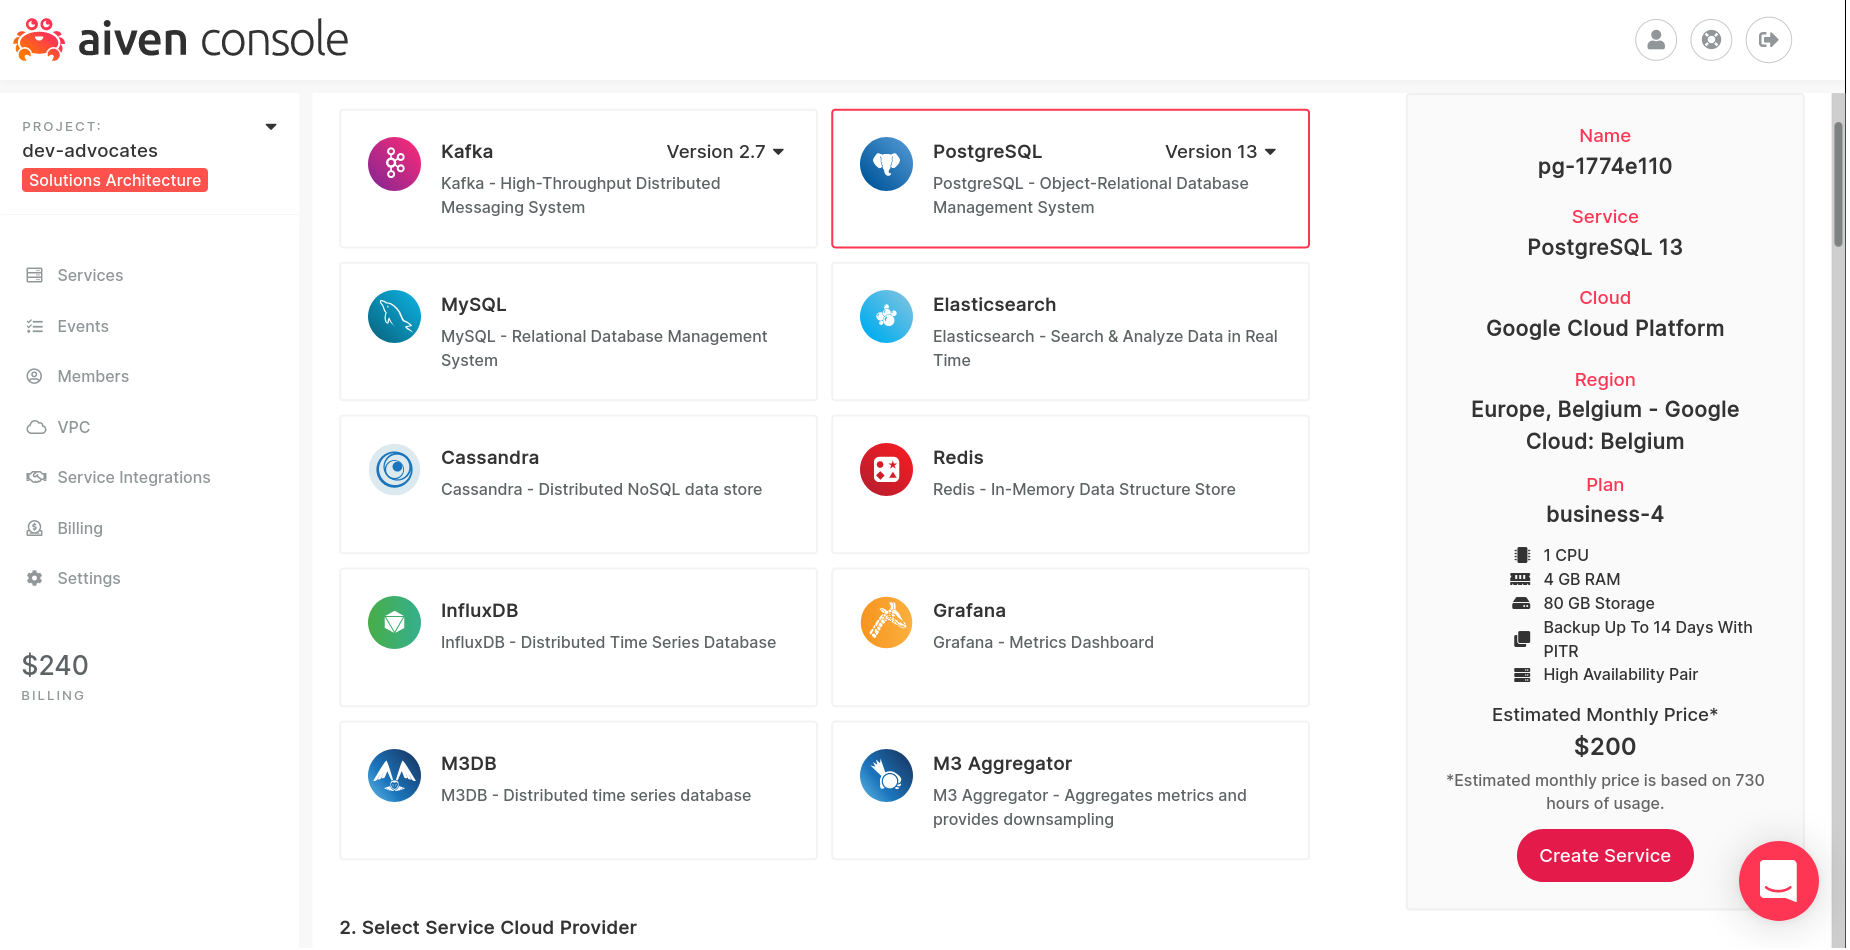
To begin with, you need a PostgreSQL service. It doesn't matter what you choose here since this service isn't going to do any important work – it's merely a temporary container for some metrics (sorry, PostgreSQL!).
With a PostgreSQL service running, you can start to collect metrics from it.
Collect metrics with Aiven for M3
From the PostgreSQL service overview page, configure the metrics integration with a new M3 service:
- Choose Manage integrations.
- Locate the one named "Send service metrics to..." (not the one for receiving), and choose Use integration.
- When prompted, create a new M3DB service, and configure it to your liking. To minimize latency, I usually use the same cloud region as the thing I'm monitoring.
The metrics collected from PostgreSQL are now being sent to M3.
Visualize the data with Grafana
The next step is to add the dashboard integration so you can see the data you are collecting. From the M3 service overview page, let's set up a Grafana dashboard:
- Choose Manage integrations.
- Select Dashboard and then Use integration.
- Choose a new Grafana service, and again, configure the service to suit your needs.
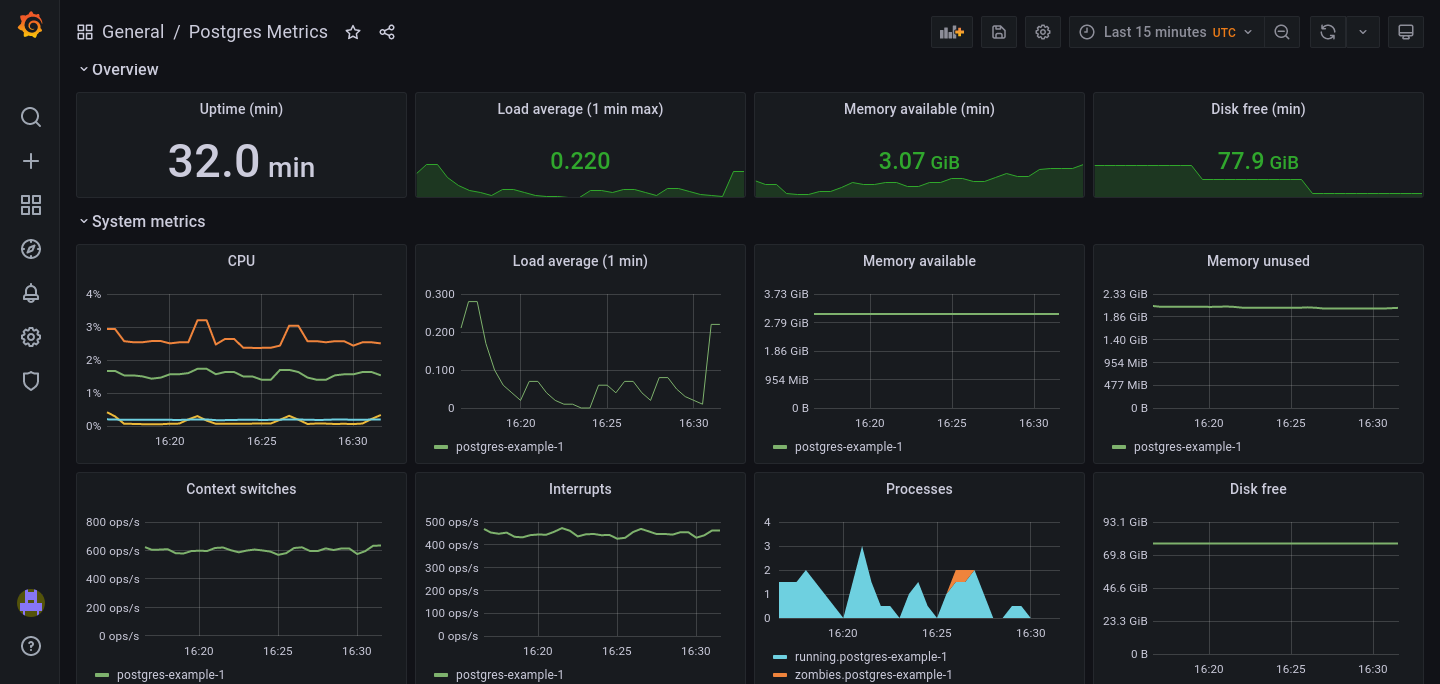
Once created, you can access Grafana by opening its Service URI in a new browser tab, and logging in with the user and password listed on the service overview page. To get you started, Aiven includes a default dashboard that shows some of the most common metrics.
To access the pre-built dashboard:
- From the left hand menu, go to the Dashboards section (4 squares) and choose Manage
- Click on the dashboard called "Aiven PostgreSQL - [database name] - Resources"
You now have a clear view of your PostgreSQL database health.
Click the dashboard settings, and choose "Save As" to use this dashboard as a template for your own that you can modify.
The list of PostgreSQL metrics exposed to Grafana gives more information about the fields that are available.
Integrations in action
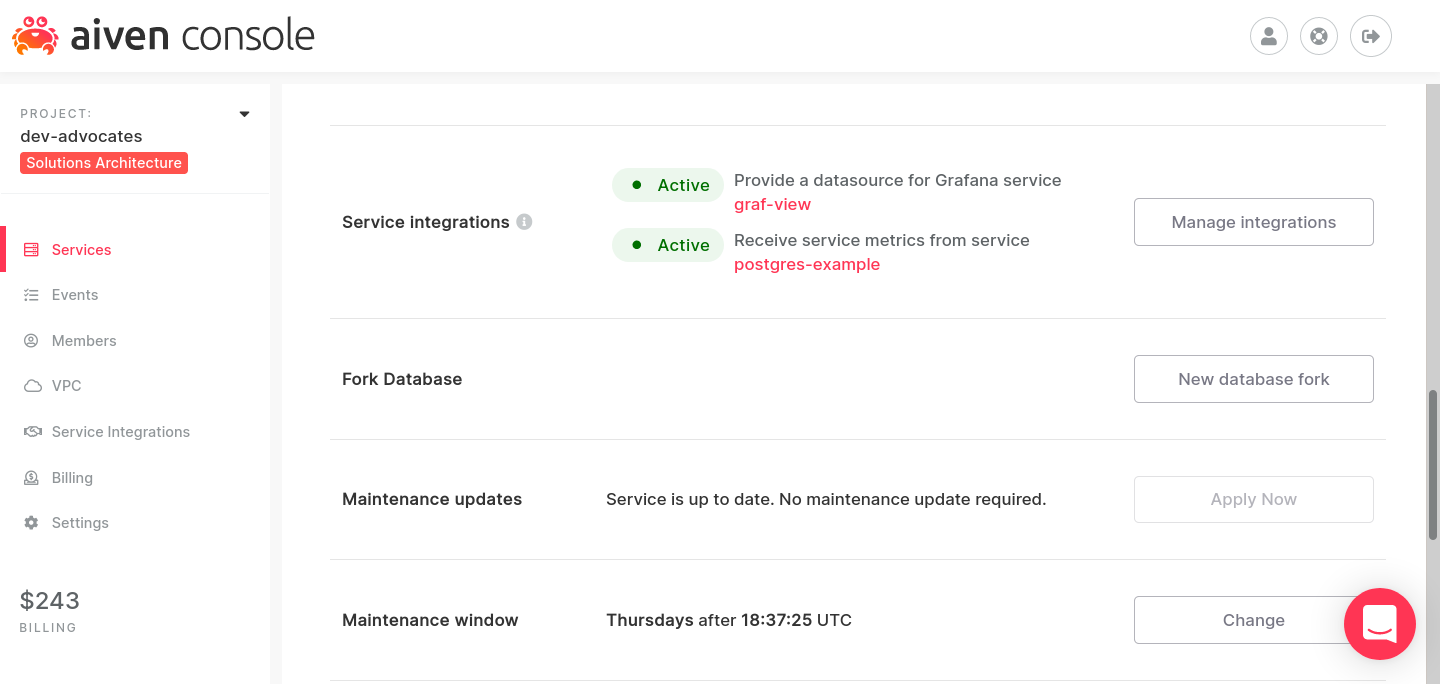
The integrations are now in place, and you can see both the data coming in and the dashboard integration from the M3 service overview page.
Following the same approach, you can add metrics integrations to all of your other Aiven services, and send data to the M3 database you created. You can also write metrics from non-Aiven services to M3 to bring all the data you need into one place, and to visualize it with Grafana.
Wrapping up and further reading
- Bring metrics from other services into M3 with our article on using Telegraf with M3.
- Build better dashboards with these tips from Grafana.
- Learn more about Aiven service integrations.
- Or learn more about time series databases
Not using Aiven services yet? Sign up now for your free trial at https://console.aiven.io/signup!
In the meantime, make sure you follow our changelog and blog RSS feeds or our LinkedIn and Twitter accounts to stay up-to-date with product and feature-related news.
Stay updated with Aiven
Subscribe for the latest news and insights on open source, Aiven offerings, and more.

