Jul 19, 2021
Navigating your Kubernetes logs with Aiven
With a container orchestrator like Kubernetes, log files are never in short supply. Find out how to make the most of that flood of data.
Aaron Kahn
|RSS FeedPre-Sales Solution Architect at Aiven
Logs are extremely important for understanding the health of your application, and in the event of problems, they help in diagnosing the issue. Methods and tools for capturing, aggregating and searching logs make the diagnosis process simpler. They are even more important with the adoption of microservices and container orchestrators, like Kubernetes, because logs come from many more places and in more formats.
With hundreds or even thousands of Pods creating logs on dozens of Nodes, it's tedious, if not impossible, to install a log capturing agent on each Pod for each different type of service. One way to solve this problem is to coordinate a Kubernetes deployment of a log agent onto each Node, capture the logs for all the Pods, and export them somewhere. We can achieve this with a Kubernetes abstraction that does not require knowing what is running on each Pod:
DaemonSet.
Briefly, a DaemonSet allows the scheduling of Pods on some or all Nodes based upon a user defined criteria.
Here's the overall process:
- Set up a Kubernetes Cluster
- Create Pods to generate logs
- Push the logs from each pod in the cluster to an external OpenSearch cluster.
I will utilize the Aiven for OpenSearch service, because it is intuitive, secure out of the box, and provides a basis for extension (e.g. pushing logs to Apache Kafka initially and then onto OpenSearch). For more information about how to do that with Aiven for Apache Kafka Connect please check out the Aiven Help article on
creating an OpenSearch sink connector for Aiven for Apache Kafka.
Install the dependencies
All the code for this tutorial can be found at https://github.com/aiven/k8s-logging-demo.
The code can be used as described in this tutorial, but if you really get into it, there are also instructions for building and deploying an API into our cluster and setting up a Kafka integration.
Let's start by cloning the repository:
git clone https://github.com/aiven/k8s-logging-demo.git
cd k8s-logging-demo
Make sure you have the following local dependencies installed:
Create the Kubernetes cluster
To create a Kubernetes cluster with Minikube, enter the following:
minikube start
You can verify that your cluster is up and running by listing
all the Pods in the cluster, like this:
kubectl get pods --all-namespaces
And you should see something like this:
NAMESPACE     NAME                               READY   STATUS        RESTARTS   AGE
kube-system   coredns-74ff55c5b-mf9dj            1/1     Running       0          14d
kube-system   etcd-minikube                      1/1     Running       0          14d
kube-system   kube-apiserver-minikube            1/1     Running       0          14d
kube-system   kube-controller-manager-minikube   1/1     Running       0          14d
kube-system   kube-proxy-bx4gl                   1/1     Running       0          14d
kube-system   kube-scheduler-minikube            1/1     Running       0          14d
kube-system   storage-provisioner                1/1     Running       2          14d
We will be using a non default namespace so let's create that
now:
kubectl create namespace logging
Add Pods to the cluster
Now that we have a nice little Kubernetes cluster, let's go ahead and do something with it. We are going to deploy a Pod that generates random logs as well as FluentD to our cluster.
FluentD is a data sourcing, aggregating and forwarding client that has hundreds of plugins. It supports lots of sources, transformations and outputs. For example, you could capture Apache logs, pass them to a Grok parser, create a Slack message for any log originating in Canada, and output every log to Kafka.
To generate logs in our cluster, let's create a Pod that generates random logs every so often:
kubectl create deployment -n logging --image=chentex/random-logger:latest logger
We're going to install FluentD using a pre-built Helm Chart, so before doing that, we have to add the repo and update the dependency. This repo contains the Kubernetes templates that describe all the FluentD components and then tells our chart to update its cache (if there is one) with these new components.
helm repo add bitnami https://charts.bitnami.com/bitnami
helm repo update
helm dependency update chart
The last part of the equation gets an external store for our logs. To do this, let's use Aiven for Elasticsearch. Go ahead and create a free account; you'll get some free credits to play around with.
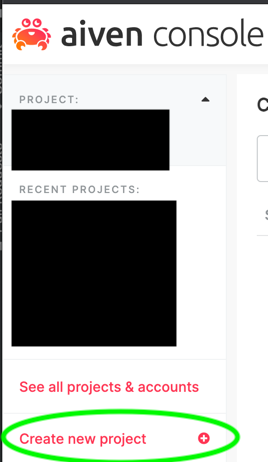
Then, create a new project in which to run Elasticsearch:
Click Create a new service and select Elasticsearch.
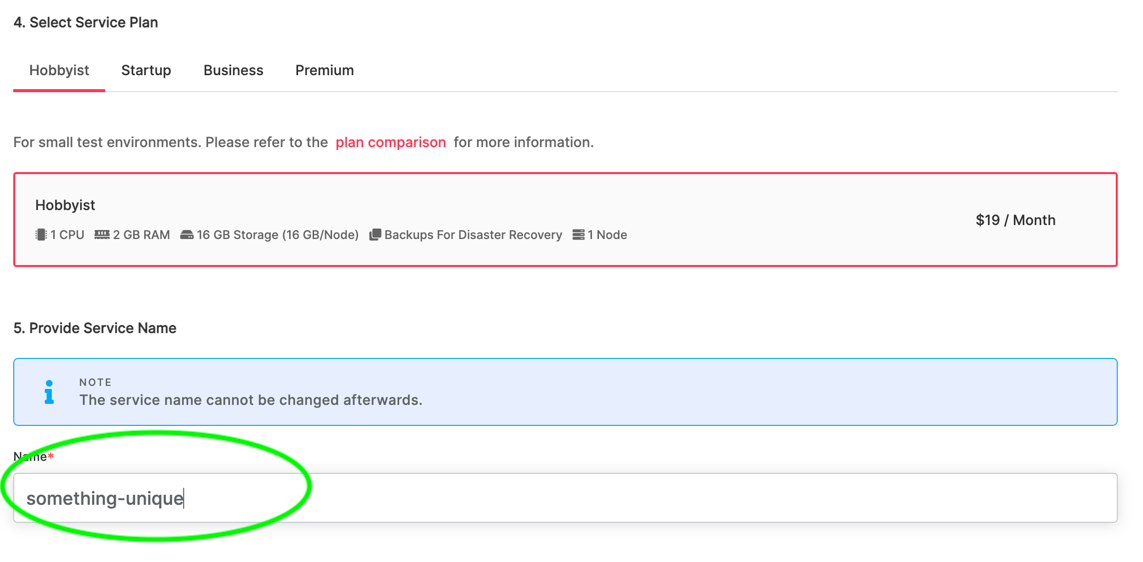
Then select the cloud provider and region of your choice. In the final step we choose the service plan -- in this case we will use a Hobbyist plan.
It's a good idea to change the default name to something identifiable at this point, as it cannot be renamed later.
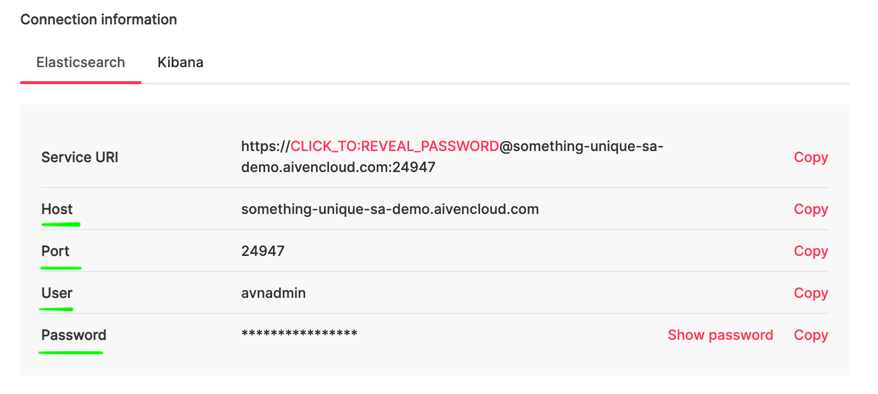
After a minute or so your Elasticsearch service will be ready to use. You can view all the connection information in the console by clicking on the service that you created.
Take note of the Host, Port, User and Password. You'll need these to configure the Helm Chart.
We are now ready to deploy our Helm Chart:
helm install -n logging log-demo chart \
--set elasticsearch.hosts=<ES Host> \
--set elasticsearch.user=<ES User> \
--set elasticsearch.pw=<ES Password>
<ES Host> should be the concatenation of the host and port we captured from the Aiven Console. In my case it looks like this:
https://something-unique-sa-demo.aivencloud.com:24947.
(Note that the values set here are only a subset of the configurations for FluentD; for the full set, see the
chart definition)
You can check that things are building correctly by investigating the Pods in the logging namespace
kubectl -n logging get pods
You should see something like
NAME                      READY   STATUS    RESTARTS   AGE
log-demo-fluentd-0        1/1     Running   0          7m32s
log-demo-fluentd-wj56t    1/1     Running   0          7m32s
logger-56db6f88d9-h8r8d   1/1     Running   0          7m8s
If all the Pods aren't ready yet, just give it a few seconds and check again, they should become ready shortly.
View and search the log entries
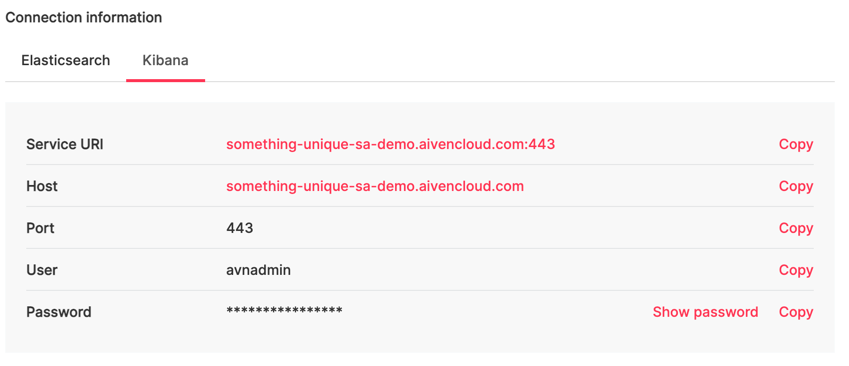
The configuration that has been deployed captures all logs from every Node (it can be configured not to do this) and so if we head over to OpenSearch dashboards we should see that happening. Aiven automatically deploys OpenSearch dashboards alongside Elasticsearch and the connection info can also be found in the console.
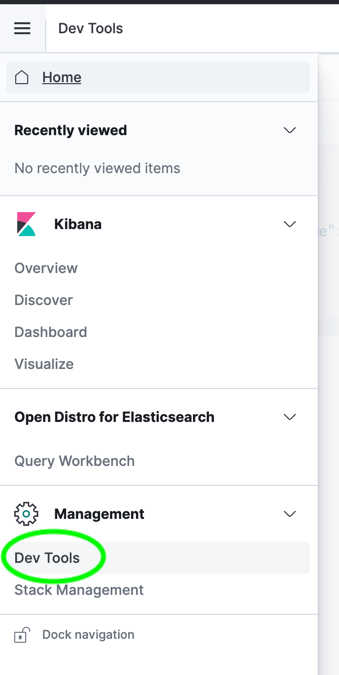
Once logged into OpenSearch dashboards, go to the dev tools.
Issue the following query, which looks for any log that originated from the kube-system namespace:
GET /_search
{
  "query": {
    "term": {
      "kubernetes.namespace_name.keyword": {
        "value": "kube-system"
      }
    }
  }
}
The results should look something like:
{
        "_index" : "minikube-2021.05.27",
        "_type" : "_doc",
        "_id" : "6dXGrnkBn7BUvoFdGaNm",
        "_score" : 0.0020360171,
        "_source" : {
          "log" : """I0527 17:01:23.041467       1 client.go:360] parsed scheme: "passthrough" """,
          "stream" : "stderr",
          "docker" : {
            "container_id" : "b8a38739fc4a2694995837f2dfe773e011432b73f641b02eb54a7622ba3baffc"
          },
          "kubernetes" : {
            "container_name" : "kube-apiserver",
            "namespace_name" : "kube-system",
            "Pod_name" : "kube-apiserver-minikube",
            "container_image" : "k8s.gcr.io/kube-apiserver:v1.20.2",
            "container_image_id" : "docker-pullable://k8s.gcr.io/kube-apiserver@sha256:465ba895d578fbc1c6e299e45689381fd01c54400beba9e8f1d7456077411411",
            "Pod_id" : "d825fef1-15d4-4202-818a-5deef0a30666",
            "host" : "minikube",
            "labels" : {
              "component" : "kube-apiserver",
              "tier" : "control-plane"
            },
            "master_url" : "https://10.96.0.1:443/api",
            "namespace_id" : "9925f802-c2c1-44a0-9a71-534d16a609af"
          },
          "@timestamp" : "2021-05-27T17:01:23.041773900+00:00",
          "tag" : "kubernetes.var.log.containers.kube-apiserver-minikube_kube-system_kube-apiserver-b8a38739fc4a2694995837f2dfe773e011432b73f641b02eb54a7622ba3baffc.log"
        }
      }
The log documents provide the log message, the namespace from which the log originated, the timestamp when the log originated, as well as several other identifying pieces of information.
Going back to OpenSearch dashboards, let's issue another request and see if we can find the logs from our logging Pod:
GET /_search
{
  "query": {
    "match": {
      "log": {
        "query": "exception"
      }
    }
  }
}
Most likely there will be several results, but the first one should be the log related to the logger Pod's random error logs.
Updates and clean up
If at any point you want to make changes to any of the deployments, e.g. change the FluentD configuration, add an endpoint to the existing service or add a whole new service:
helm upgrade -n logging log-demo <other parameters set during install>
You may need to redeploy Pods for changes to take effect.
To tear down the installation:
helm delete -n logging log-demo
kubectl delete -n logging deployment/logger
Wrapping up
This guide started from nothing and created a Kubernetes application with a logging layer.
The code and steps here could easily be expanded upon to use a different Kubernetes provider such as Google Kubernetes Engine (GKE) or Elastic Kubernetes Service (EKS) and the Helm configuration could easily be expanded to include other use cases such as sending data to Kafka or capturing metrics as well.
Regardless of where the data comes form or where it goes or what kind it is, the Aiven platform has the tools and services to assist you on your journey.
Further reading
External Elasticsearch Logging
Kubernetes Logging Architecture
Kubernetes Logging with ELK Stack
Not using Aiven services yet? Sign up now for your free trial at https://console.aiven.io/signup!
In the meantime, make sure you follow our changelog and blog RSS feeds or our LinkedIn and Twitter accounts to stay up-to-date with product and feature-related news.
Stay updated with Aiven
Subscribe for the latest news and insights on open source, Aiven offerings, and more.

