Oct 31, 2022
Streaming data analytics in the real world
Already using Apache Kafka®? Here’s why you should be analyzing your streaming data, not just moving it around.
Your system works, but it could work better. A lot of businesses set up with a reasonable idea of the direction they want to take their product, but not how to get the most out of the data they’re collecting.
Everyone’s talking about Apache Kafka® as an ecosystem. Once you recognize the importance of data analytics, the question shifts from “can this ecosystem streamline my systems?” to “what part of this ecosystem isn’t working for me?”
Streaming data analytics differ from traditional (or “batch”) analytics. Apache Kafka® is already changing the face of data performance. But can your analytics weather these changes, or is it just plain taking too long to get your dashboards updated? You want your info presented nicely on your dashboards, not just for the previous month or the previous year, but hourly or per minute. Or even more frequently!
There are different approaches to streaming data analytics.
The evolution of analytics
Analytics is a concept that is constantly on the move. Faster, sharper, more stable and performant, and all of it right now.
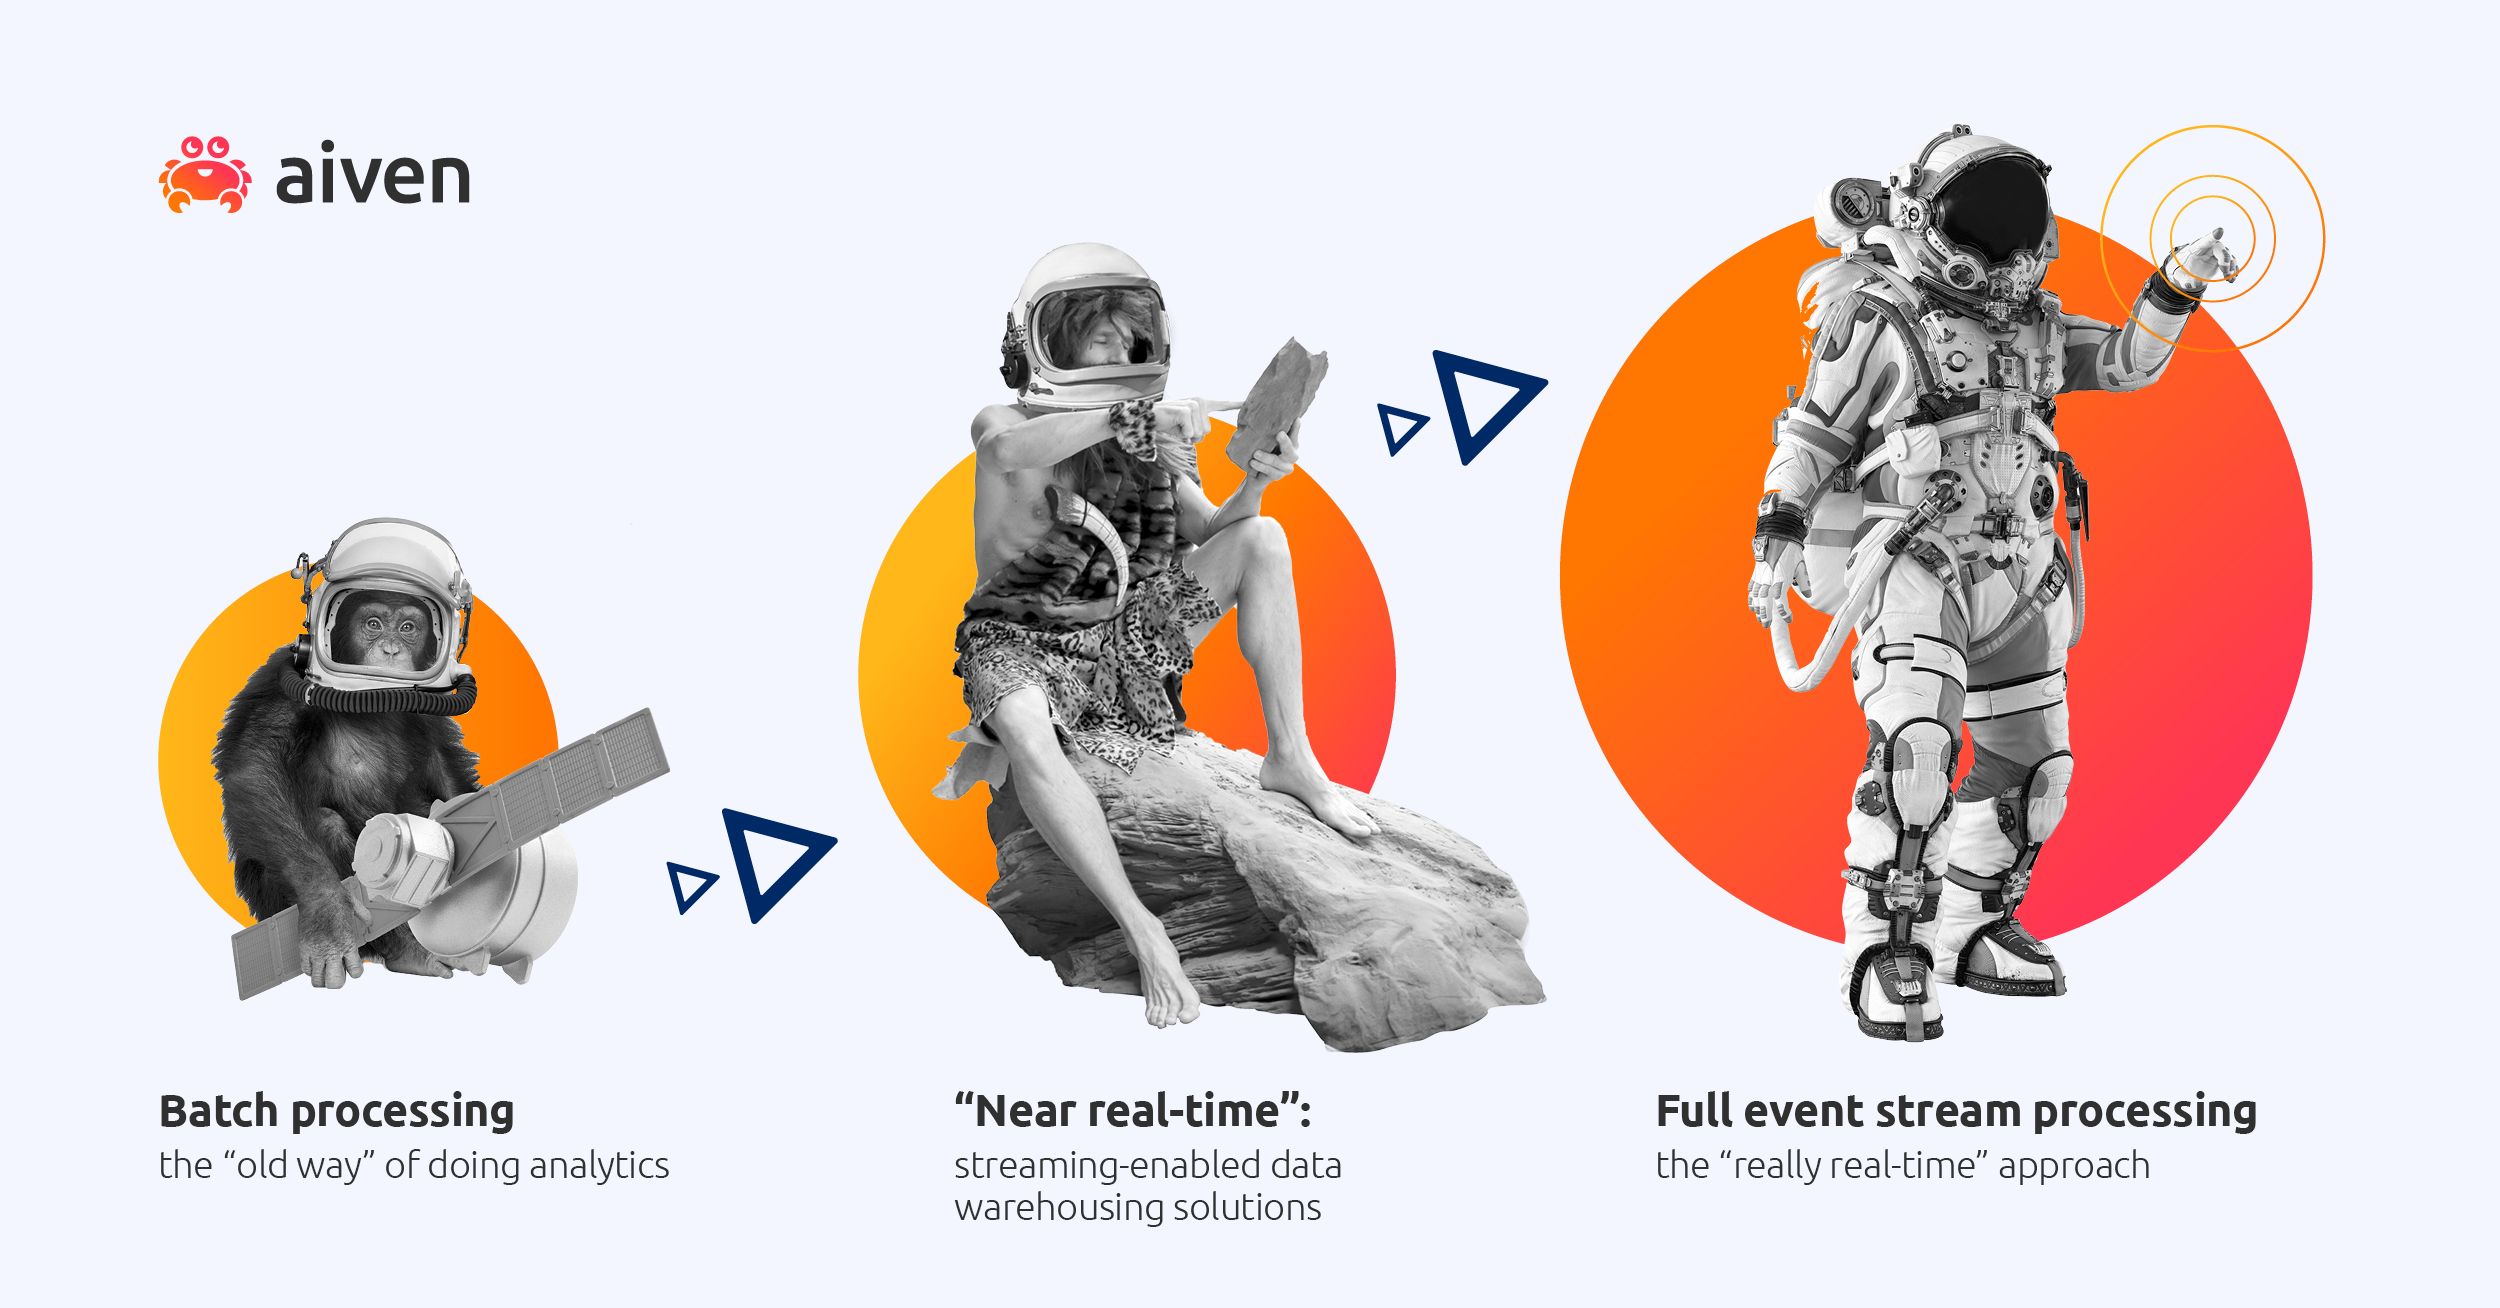
We’re going to look at these stages a little bit out of order now, bear with us.
The primordial data soup
Batch processing is still used in a lot of businesses and institutions. Analytics the "old way" can take days to get your dashboards updated, and requires some complex data pipelines.
Does it make sense to combine this traditional approach to analytics with the new ways of real-time data? Maybe, sometimes, when your analytics pipelines are all in place and you don't need performance on that level. But in most cases this isn’t a great solution, so you should look into the other options.
The intelligent ape
This is it, the full real-time dream: event stream processing through technologies such as Apache Flink or Confluent’s ksqlDB (these are just two examples of many!), event by event, processing and analyzing to full effect.
This is something you need if you want to take sub-second action - like automated stock trading, alerting based on data sent by an IoT device, or filtering some sensitive data from the stream before it is sent forward.
This isn’t something you need, really, if you just want a dashboard that’s refreshed every 5 seconds (for example). For that, you'd be better off with a streaming-enabled data warehouse that can handle the volumes of incoming data, store it permanently for historical analysis, and provides ready integrations to dashboarding tools like Grafana, Tableau, Sisense and more.
Sure, it’s something to aim for … but only if you need it. Otherwise, it’s just wasted effort climbing that learning curve. A blended approach makes sense in many cases. Event stream processing for filtering and alerting based on the data, and a streaming-enabled data warehouse for creating the analytical dashboard views.
The missing link
Somewhere in between these stages is the "near real-time". It offers a wide range of ways to optimize both ends of the evolutionary ladder. Streaming-enabled data warehouses, like ClickHouse, are simple and - for many use cases - more than fast enough. We’re talking about seconds or minutes here, so it’s still fast.
You already have the data stream. With a streaming enabled data warehouse, you can capture and keep history of all that data. It can show emergent trends or projected developments, and execute preliminary analysis. Perform aggregations over your data to your reports, as well as digging deeper into individual events so you don't lose a single detail.
So what kind of everyday data systems fall into this category, and where can a livelier approach to analytics be of benefit?
Near real-time analytics in the real world
A little thing called GDPR
General Data Protection Regulation (GDPR) unites event stream processing with Apache Flink®, and data warehousing with ClickHouse®. GDPR is everywhere. Apache Flink keeps users’ private data private, while ClickHouse still enables analysis.
Say your business needs to perform analytics on GDPR-protected information. Here we have two systems that are “allowed” to see and process personal information. Taxation service data, medical records … but private content is not for sharing. Filter out the PII data with Apache Flink, so ClickHouse can generate analytics dashboards from the anonymized data. Your analysts can then look at the data in ClickHouse without worrying about GDPR violations.
Customer-facing dashboards
Self-serve dashboards are used, for example, by energy companies. They provide their customers with interfaces where they can check their energy consumption in real time.
Companies that want to give their customers a handy chatbot to interact with can set up a platform to provide an analytics view. It checks the number of conversations, sent and received messages, average session length, and more.
Clickstreaming
Product analytics teams collect “clickstreams” from users using their applications. Click-by-click tracking of user actions - which is where ClickHouse came from - can provide real-time insights for user journeys, lifecycles, retention, app usage, experimentations, and more.
Software vendors building products depend on product analytics to tell them what’s working and what isn’t. And there’s lots of data to play with. It’s invaluable data for advertising and any other site usage … and it has to be handled with care.
Analytics in fraud detection
Financial institutions, classically, depend on real-time or near-as-possible-to-real-time data analysis. This is required for tracking their customers, the transactions that are taking place using their systems, and exposing the impostors who might be attempting to take advantage of vulnerabilities.
They’re protecting the institutions that much of the modern world hinges on. There aren’t many more vital use cases for data analytics. This places fraud detection, in terms of its needs, right on the cusp of our “near real-time” and “really real-time” evolutionary shift.
Every solution has a problem
Just as every (data handling) problem has a (streaming analytics) solution, every solution also kind of has a problem.
- Your batch analytics systems are always going to have issues with performance and complexity.
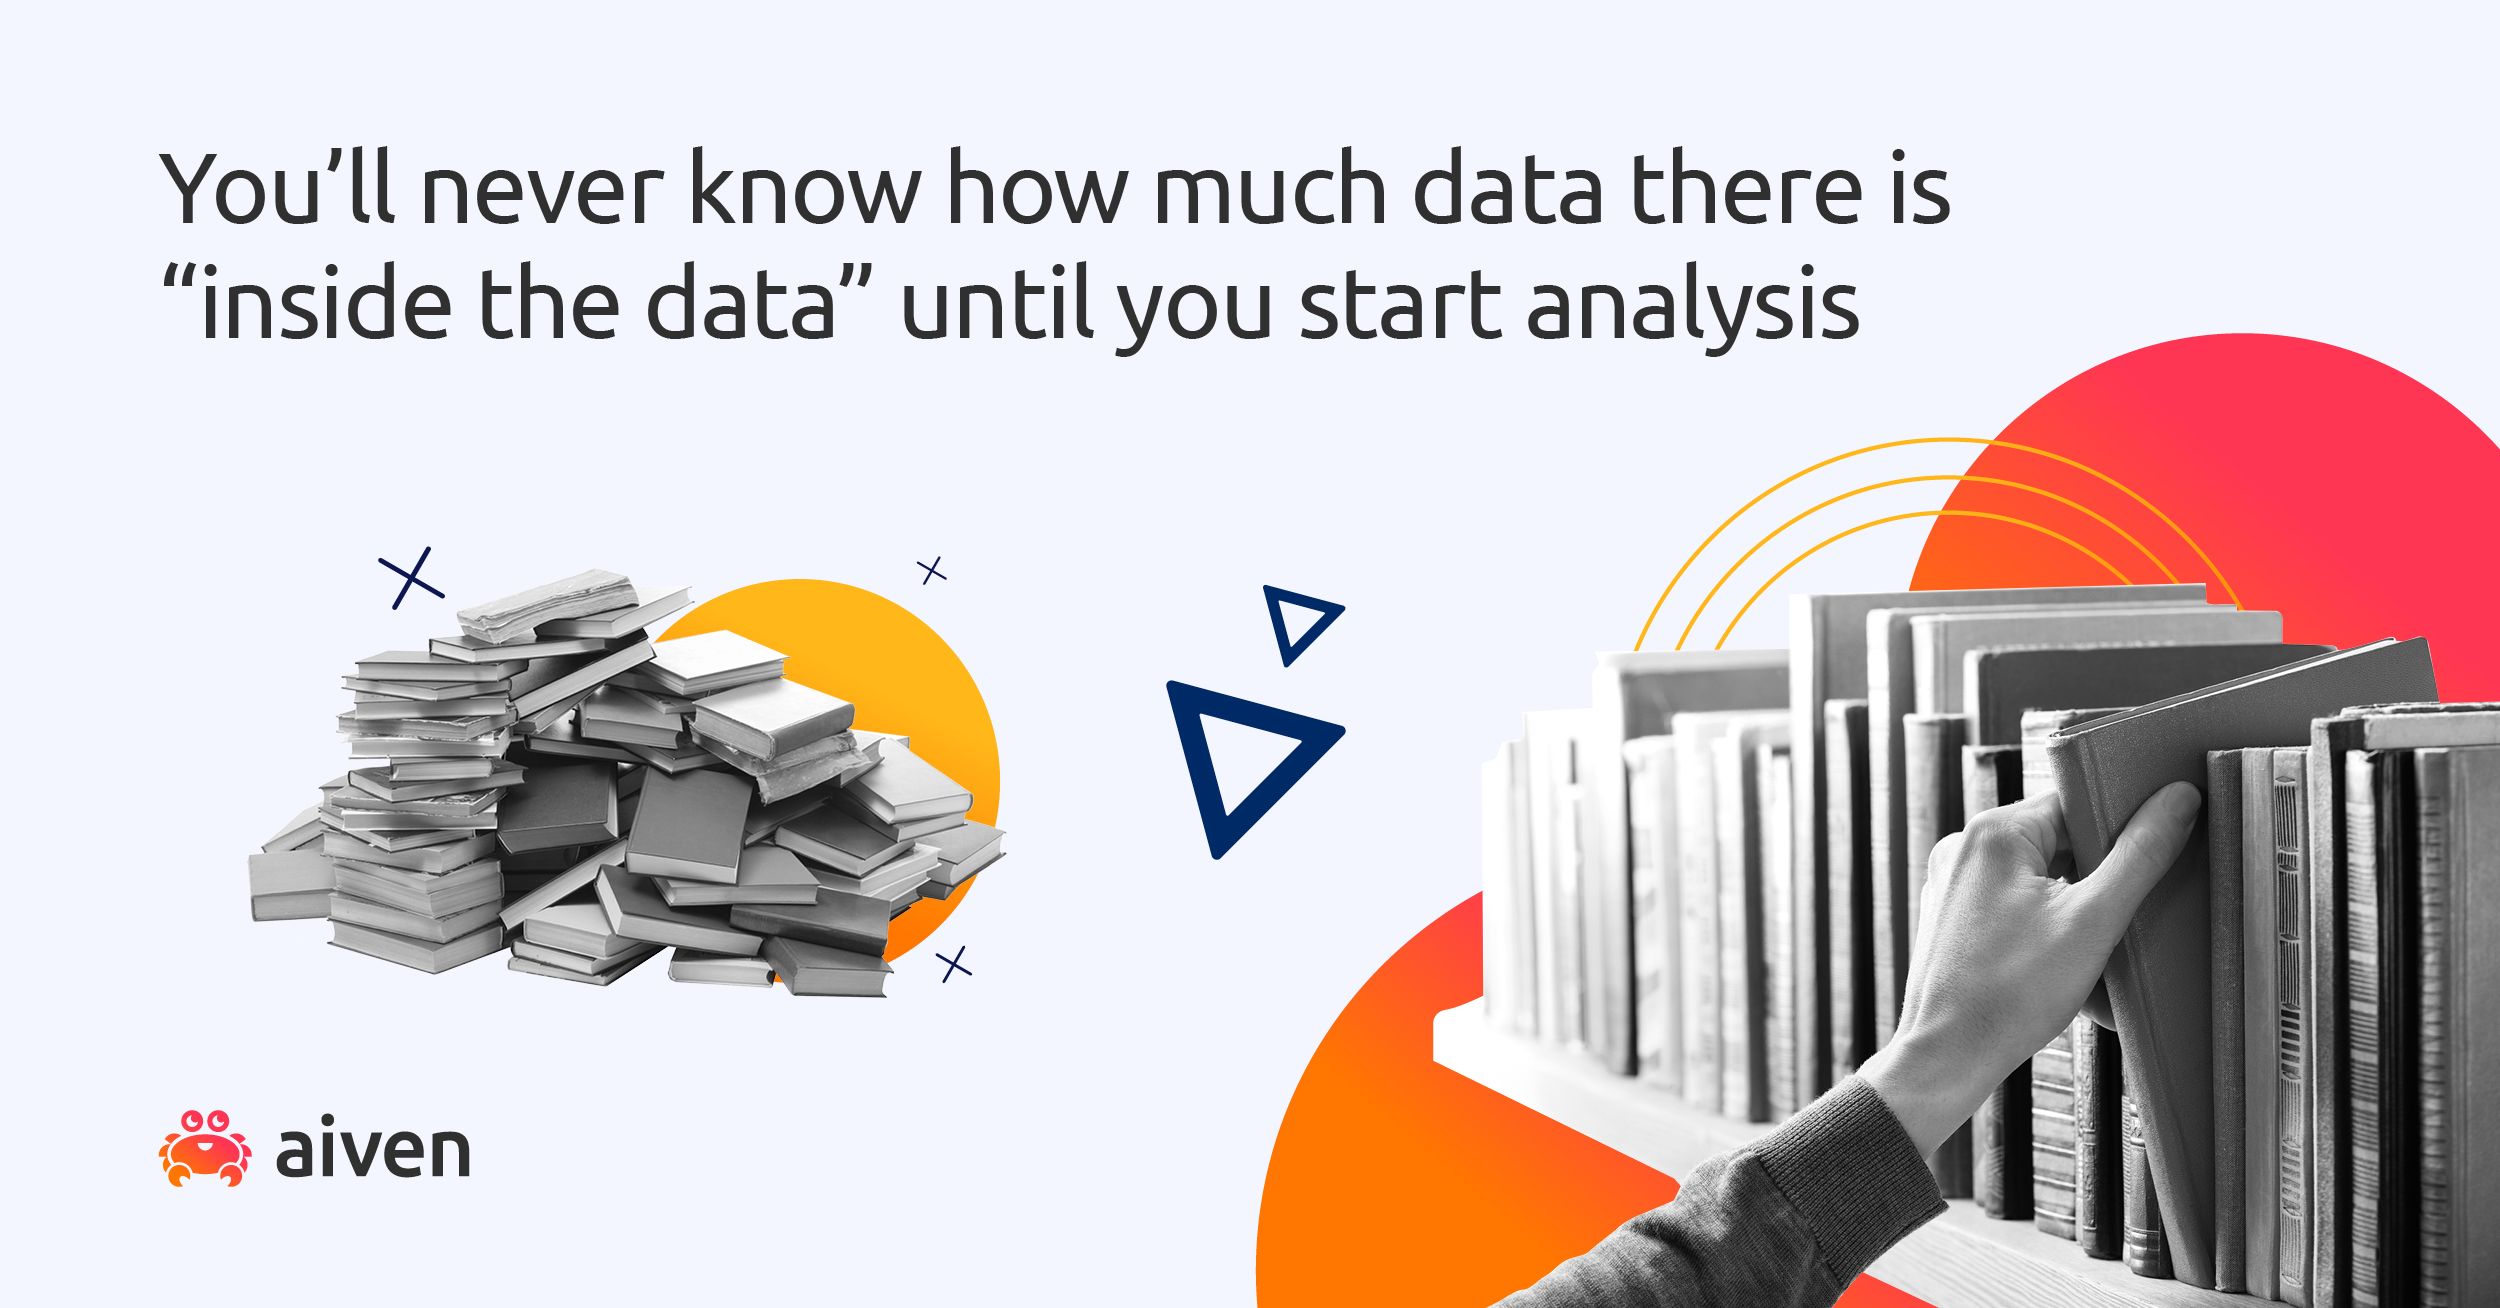
- Aggregations are needed, and insights are lost. At the same time, too much aggregation can cause you to lose hidden insights that might be of great value.
- Apache Kafka acts as a data hub and messaging platform, yes, but it doesn't do more in analyzing the data - that’s not what it’s for.
- Apache Flink is at its best when doing data transformation or immediate actions based on quick event analysis. It’s not ideal for a 'traditional' analytics dashboard, as it requires a separate datastore for storing the processing results before they can be visualized.
- ClickHouse deals with a lot of throughput, but it’s more about storage and quick queries than immediate actions based on the data.
Analyzing the messages that are going through Apache Kafka has palpable benefits. What do you have that could work, but isn’t because you’re not using analytics? You need all of your data to be accessible for proper analysis.
Since we’re already talking about evolution, let’s take a scientific method approach. Only … we’re going to do it backwards. Kind of.
Approach it backwards (or … sideways?)
In the scientific method, you start with a question and use the data available to arrive at your answer. Interpreting or changing things to get the answer you want is a big no-no.
When it comes to data analytics, though, you start with what you want to get out of your data. Then you figure out which tools you need in order to get the information you want.
Transformation is coming
How have successful companies from a range of industries used a managed data platform as part of their transformation strategy? Check out how they solved their business and technical challenges from our ebook.
Grab it hereMaybe you’re a manufacturer looking for the most efficient and effective way to support the drivers of your electric cars. You’re using Apache Kafka as a standardized messaging platform, but you need to move all that data into a warehouse and perform analysis on it so you can find out, for example:
- Which charging sites are more or less commonly used
- Where power is coming from
- Where failures are occurring
Don't make decisions based on a pile of old data. Take the guesswork out of it. And let Aiven help.
Wrapping up
If you’re at the stage where you’re trying things out, you don’t need to know it all. Want some ideas on where to start? We’ve got you covered.
Build a real-time analytics pipeline
Learn more about event streaming architecture with Apache Kafka® and Apache Flink®, landing data into real-time analytics data warehouse ClickHouse®
Check out our blog postTo get the latest news about Aiven for Apache Kafka® and our other services, plus a bit of extra around all things open source, subscribe to our monthly newsletter! Daily news about Aiven is available on our LinkedIn and Twitter feeds.
If you just want to stay in the loop about about our service updates, follow our changelog.
Are you're still looking for a managed data platform? Sign up for a free trial at https://console.aiven.io/signup!
Struggling with the management of your data infrastucture? Sign up now for your free trial at https://console.aiven.io/signup!
Further Reading
Table of contents
- The evolution of analytics
- The primordial data soup
- The intelligent ape
- The missing link
- Near real-time analytics in the real world
- A little thing called GDPR
- Customer-facing dashboards
- Clickstreaming
- Analytics in fraud detection
- Every solution has a problem
- Approach it backwards (or … sideways?)
- Wrapping up
- Further Reading
Stay updated with Aiven
Subscribe for the latest news and insights on open source, Aiven offerings, and more.


