Oct 20, 2022
Strengthen your monitoring game with Grafana® 9
Aiven now offers Grafana® 9 as a managed service. Let’s take a look at how we’re bringing it to you and what the key improvements are.
Hoang Minh Vo
|RSS FeedTechnical Product Manager
With our commitment to open source, Aiven always strives to bring the best open-source tools to our customers. We believe that Grafana® 9 is the best open-source visualization technology to date.
The new Grafana release brings a wealth of new capabilities, such as:
- Prometheus query builder
- Improved User Interface
- New heatmap model
Grafana 9 simplifies your monitoring process tremendously.
New and updated features
Prometheus query builder
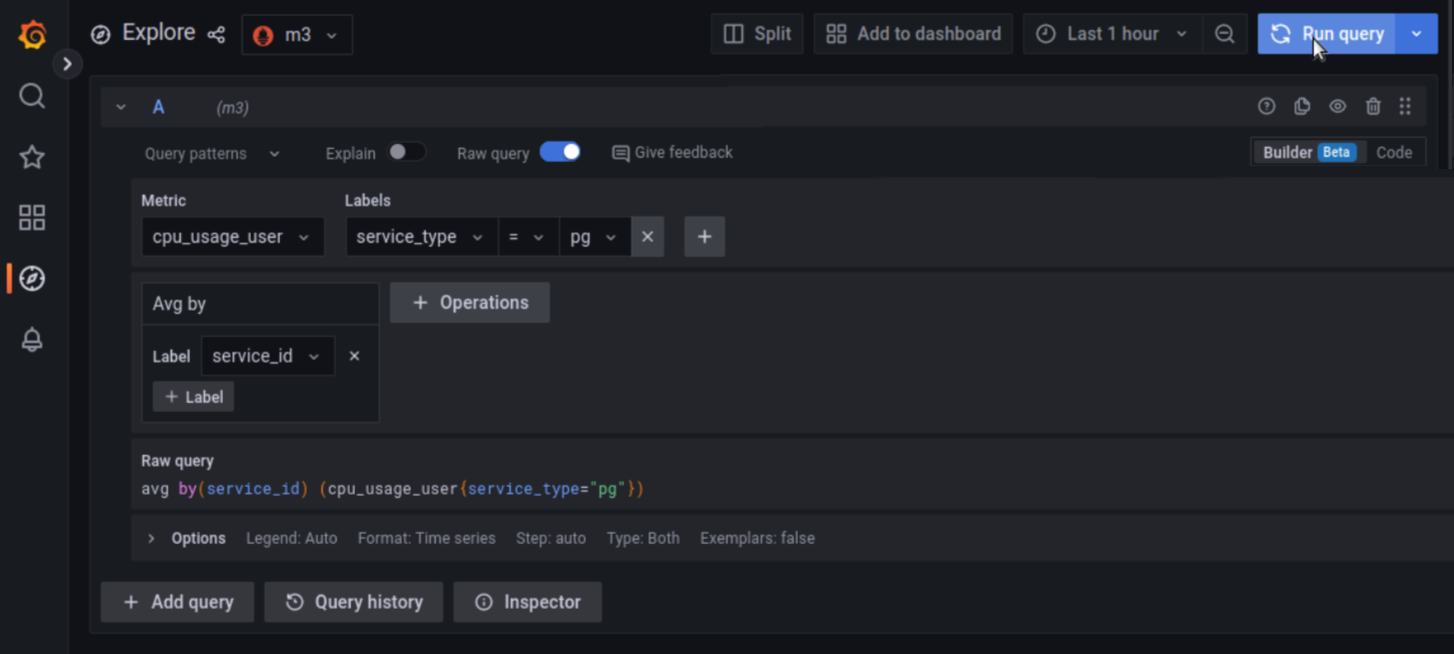
Prometheus is a technology agent widely used to pull metrics from different sources. At Aiven, we also use it for our Metrics integration solution. PromQL is not the easiest language, however, and has a steep learning curve. Grafana 9 tackles this problem by bringing the PromQL query builder into the picture.
This is how PromQL query builder makes your life easier:
- Enables you to select and search multiple metrics and labels at the same time.
- Helps you clearly define different operations and aggregations that are ongoing within the same query.
PromQL query builder also keeps the code-based user interface for those hard-core developers.
New heatmap panel
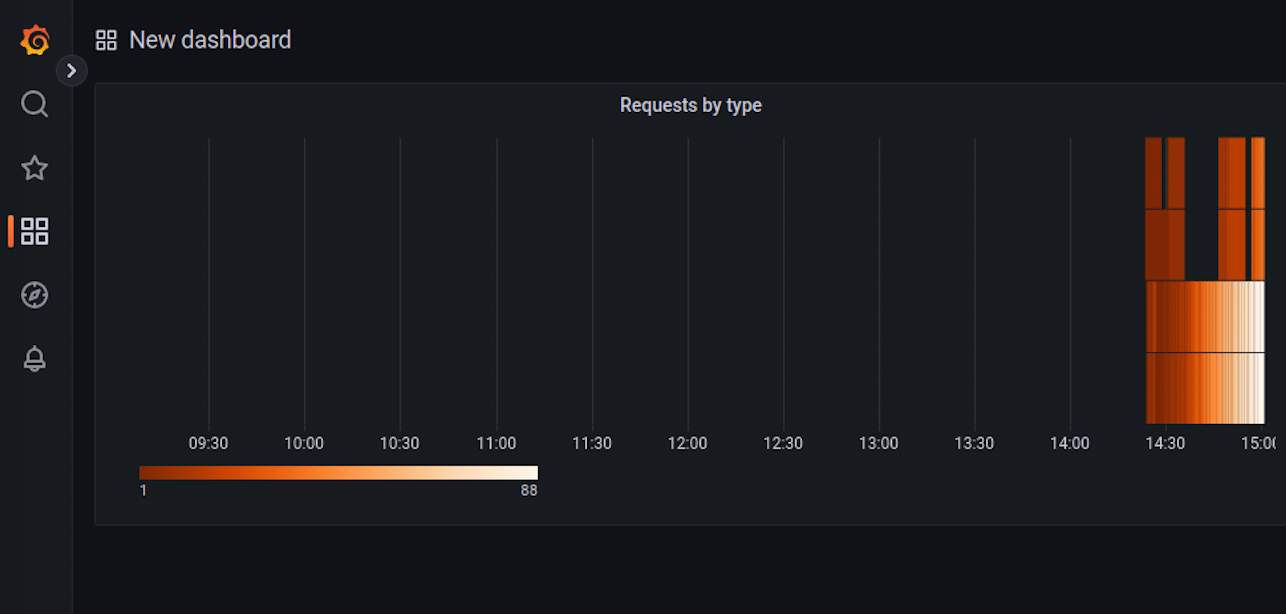
Time series data is an essential part of monitoring and observability. It carries crucial information about your services throughout a given period of time and gives you insights into how your services performed. The heatmap in Grafana helps to visualize the massive amounts of time series data as a histogram.
In Grafana 9, the way heatmaps are displayed has been revamped. The new heatmap panel brings multiple new features:
- Exemplars (traces) overlay to help isolate data distribution problems
- Prometheus sparse histograms to enhance data analysis when creating separate buckets would not be feasible
- Customization for the number of colors shown, reflecting the granularity
- Smarter automatic bucket sizing for unbucketed data
- Can filter out bucket values close to but not exactly zero
In addition, the new heatmap is several orders of magnitude faster than the old one.
Improved user interface
Dashboard previews
Dashboard previews is a new enhancement coming to live in Grafana 9. Instead of relying on Title name, customers can now have a graphical representation of their dashboard to better differentiate between multiple dashboards.
This feature is available as an opt-in feature in Aiven Console for Grafana service, under “Advanced Configuration”.
Panel title search
An improved search capability for your list of panels. This feature is also enabled as an opt-in feature in Aiven Console for Grafana service, under “Advanced Configuration”.
Starred dashboards
Easier access to your favorite dashboard straight from the navigation. This feature is enabled in Aiven for Grafana by default.
Breaking changes
Some of the changes to Grafana 9 can break builds. Take a look at the full list of Grafana 9 changes to find potential problem areas.
Upgrade your Aiven for Grafana
Grafana 9 is available in the Aiven Console, and we have provided a safe upgrade path from Grafana 8. You can either upgrade your Aiven for Grafana manually, or wait for the next scheduled update.
If you’re still looking for a great managed Grafana service, check out our Aiven for Grafana product page!
Daily news about Aiven is available on our LinkedIn and Twitter feeds. If you just want to stay up to date with our service updates, follow our changelog.
Stay updated with Aiven
Subscribe for the latest news and insights on open source, Aiven offerings, and more.

